1,3,4,5,6Department of Pharmaceutics, Konkan Gyanpeeth Rahul Dharkar College of Pharmacy and Research Center, Karjat (India).
2Associate Professor, Department of Pharmaceutics, Oriental College of Pharmacy, Sanpada Navi Mumbai, India
This study aimed to formulate and evaluate transdermal patches of Ketorolac Tromethamine for sustained drug release and improved patient compliance. Patches were prepared using the solvent casting method with HPMC K15 and PVP K30, incorporating plasticizers and permeation enhancers. The formulations were assessed for physicochemical properties, drug content uniformity, and in-vitro drug release. The patches exhibited smooth, transparent, and non-sticky surfaces, with uniform weight, thickness, and good mechanical strength. Drug content (95%–98%) and moisture content (2.22%–3.45%) were within acceptable limits. In-vitro release studies showed sustained drug release, with F6 achieving 100.02% at 10 hours. FTIR and DSC analyses confirmed drug-excipient compatibility. The results suggest that Ketorolac Tromethamine transdermal patches could be a promising alternative to conventional formulations, warranting further in-vivo studies.
Pain management remains a crucial aspect of clinical medicine, particularly in conditions involving acute or chronic pain. Non-steroidal anti-inflammatory drugs (NSAIDs) like Ketorolac Tromethamine (KT) are widely used due to their potent analgesic and anti-inflammatory properties [1]. However, conventional oral and parenteral routes of administration often pose challenges such as gastrointestinal irritation, first-pass metabolism, fluctuating plasma drug levels, and poor patient compliance. These limitations highlight the need for alternative drug delivery approaches that can improve therapeutic outcomes while minimizing adverse effects. Transdermal drug delivery systems (TDDS) have emerged as an effective strategy to address these challenges by enabling controlled and sustained drug release through the skin [2,3]. TDDS bypasses hepatic first-pass metabolism, reducing gastrointestinal complications and ensuring prolonged therapeutic action with improved bioavailability. Moreover, transdermal patches provide non-invasive administration, patient convenience, and steady plasma drug levels, making them a promising alternative for pain management.
Ketorolac Tromethamine, a pyrrolizine carboxylic acid derivative, is a potent NSAID that exhibits strong analgesic and moderate anti-inflammatory activity by inhibiting cyclooxygenase (COX-1 and COX-2) enzymes, thereby reducing prostaglandin synthesis. It is commonly prescribed for short-term pain relief in postoperative conditions, musculoskeletal disorders, and inflammatory diseases. However, its oral and injectable formulations are often associated with severe gastrointestinal toxicity, renal impairment, and bleeding risks, restricting its prolonged use. A transdermal patch formulation of Ketorolac Tromethamine could offer significant advantages by maintaining consistent drug levels, minimizing systemic toxicity, and improving patient adherence. The successful formulation of a transdermal patch depends on several factors, including drug solubility, skin permeability, polymer selection, adhesive properties, and the incorporation of penetration enhancers to facilitate drug diffusion through the stratum corneum [4]. Various polymers such as hydroxypropyl methylcellulose (HPMC), Polyvinyl Pyrollidone (PVP K30) and Polyethylene Glycol are commonly explored for transdermal applications due to their excellent film-forming properties, biocompatibility, and controlled-release characteristics. This study aims to formulate and evaluate a transdermal patch of Ketorolac Tromethamine using suitable polymers and excipients to optimize drug release, permeability, and mechanical strength. The formulated patches will be subjected to comprehensive physicochemical and in-vitro evaluation, including thickness measurement, tensile strength analysis, folding endurance, drug content uniformity, in-vitro drug release studies, and skin permeation studies using excised skin models. By developing an effective transdermal patch for Ketorolac Tromethamine, this research seeks to enhance the therapeutic potential of the drug while reducing its systemic adverse effects. The findings from this study could contribute to the advancement of transdermal drug delivery as a viable alternative for NSAID administration, ultimately improving pain management strategies in clinical settings.
MATERIALS AND METHODS
Materials
The drug used in the study included Ketorolac, procured from Cipla Pharmaceuticals Pvt. Ltd., Baddi, Himachal Pradesh (India) and various polymers, excipients and solvents obtained from reputable suppliers.
Methods
Pre-formulation Studies
Solubility Study
The solubility of Ketorolac Tromethamine was evaluated in various solvents, including hydrochloric acid (HCl), ethanol, methanol, water, and phosphate buffer (pH 6.8). This study was conducted to determine the most suitable solvent for formulation development and to ensure optimal drug dissolution and permeability in the transdermal system [5].
Melting Point Determination
The melting point of Ketorolac Tromethamine was determined to assess its purity and thermal stability. A small amount of the drug was placed in a capillary tube sealed at one end and attached to a thermometer using a string. The capillary tube was immersed in Thiel’s tube, and the temperature at which the drug transitioned from solid to liquid was recorded. The determination was conducted under constant pressure to ensure accuracy, as the melting point serves as a key physicochemical parameter in drug characterization [6].
Preparation of Standard Calibration Curve
a) Determination of ?max
The determination of the maximum absorption wavelength (?max) of Ketorolac Tromethamine was carried out using a UV-visible spectrophotometer. A standard solution of Ketorolac Tromethamine was prepared at a concentration of 20 ?g/mL in an appropriate solvent, following Beer-Lambert's law. The solution was scanned over the wavelength range of 200–400 nm to identify the absorption maximum. The UV spectrum obtained demonstrated the highest absorbance peak at 322 nm, which was selected as the analytical wavelength (?max) for further spectrophotometric analysis [7].
b) Preparation of Calibration Curve
A calibration curve of Ketorolac Tromethamine was constructed by preparing a stock solution of 1000 ?g/mL in phosphate buffer (pH 6.8). From this, a working stock solution of 10 ?g/mL was prepared and further diluted to obtain standard concentrations of 2, 5, 10, 12, and 15 ?g/mL. The absorbance of these solutions was measured at 322 nm using a UV-visible spectrophotometer, and a calibration curve was plotted to establish the linearity of the method for quantitative analysis [7,8].
Compatibility Study (FTIR)
Fourier Transform Infrared (FTIR) spectroscopy was performed to identify Ketorolac Tromethamine and analyze possible interactions between the drug and excipients. The FTIR spectra of the pure drug and formulated transdermal patch were recorded using the FTIR-1700 Shimadzu analyzer. The spectra were obtained using the KBr pellet method, and characteristic peaks were analyzed to confirm the presence of functional groups and ensure compatibility between the drug and excipients [9].
Differential Scanning Calorimetry (DSC) Study
Differential Scanning Calorimetry (DSC) was performed to evaluate potential physical and chemical interactions between Ketorolac Tromethamine and excipients. The thermal behavior of the pure drug and its composite mixtures was analyzed using a DSC-60 Shimadzu instrument [9,10].
Method for Preparation of Transdermal Patches
Solvent Casting Method
Matrix-type transdermal patches of Ketorolac Tromethamine were formulated using the solvent evaporation technique. Different ratios of HPMC K15 and PVP K30 were accurately weighed and allowed to swell for 6 hours in a solvent mixture. A plasticizer such as PEG 200 or Propylene Glycol and a permeation enhancer like menthol or eucalyptus oil were incorporated to enhance flexibility and drug permeation. The drug solution was then blended with the polymeric solution, cast onto a petri plate, and left for air drying overnight, followed by vacuum drying for 8–10 hours to obtain a stable transdermal patch [11].
Table 1: Formulation Batch (F1-F6)
|
Ingredients |
F1 |
F2 |
F3 |
F4 |
F5 |
F6 |
|
Ketorolac(mg) |
10 |
10 |
10 |
10 |
10 |
10 |
|
HPMC K15M (mg) |
450 |
650 |
750 |
850 |
900 |
1000 |
|
PVP K30 (mg) |
100 |
50 |
100 |
150 |
50 |
- |
|
IPA (ml) |
10 |
10 |
10 |
15 |
15 |
15 |
|
Chloroform (ml) |
10 |
10 |
10 |
10 |
15 |
15 |
|
Menthol (ml) |
0.5 |
0.2 |
0.5 |
- |
- |
13.3 |
|
Eucalyptus oil (ml) |
0.3 |
0.3 |
0.3 |
0.3 |
0.3 |
0.3 |
|
PEG (ml) |
0.25 |
0.25 |
0.25 |
0.25 |
0.25 |
0.25 |

Figure 1: Formulation Batch (F1-F6)
Evaluation of Prepared Transdermal Patches
Organoleptic Test
The transdermal patches were evaluated for organoleptic properties to ensure their physical integrity and aesthetic appeal. The patches were visually inspected for color, clarity, flexibility, and smoothness to confirm uniformity and acceptable formulation characteristics. These parameters are essential for patient compliance and overall quality assessment of the patches.
Weight Uniformity
The weight uniformity of the transdermal patches was assessed by weighing four patches from each batch using a digital balance. The average weight and standard deviation were calculated to ensure consistency in patch formulation. This test ensures uniform drug distribution and reproducibility of the transdermal patches.
Thickness of the Films
The thickness of drug-loaded polymeric films was measured using a digital vernier calliper to ensure uniformity. Measurements were taken at five different points four at the corners and one at the center of the patch. The average thickness and standard deviation were calculated for each formulation to confirm consistency and reproducibility [12-14].
Folding Endurance
Folding endurance was determined to assess the mechanical strength and flexibility of the transdermal patches. A 2 × 2 cm?2; strip of the patch was repeatedly folded at the same point until it broke. Alternatively, the film was manually folded at a 180° angle until it developed cracks or broke, and the number of folds was recorded. The average folding endurance and standard deviation were calculated from three readings for each formulation, ensuring durability and handling stability of the patches [15].
Percentage Moisture Content
The percentage moisture content of the prepared films was determined to assess their moisture retention and stability. Initially, each film was weighed individually and then placed in a desiccator containing silica gel at room temperature for 24 hours to allow moisture to evaporate. After 24 hours, the films were weighed again and the percentage moisture content was calculated using the following formula:
% Moisture Content= [(Initial weight – Final weight)/Final weight] x 100
Drug Content Uniformity
The drug content uniformity of the transdermal patches was assessed to ensure consistent distribution of the active pharmaceutical ingredient (API) in each patch. A standard test procedure was followed as per established pharmacopoeia guidelines. Each 2 × 2 cm?2; film from the batch was cut and mixed with 50 mL of phosphate buffer (pH 6.8), resulting in a concentration of 1000 ?g/mL. The solution was then filtered using Whatman filter paper, and a 1 mL aliquot was pipetted into a 100 mL volumetric flask, diluted with phosphate buffer (pH 6.8) to achieve a concentration of 10 ?g/mL. The resulting solution was analyzed using a Shimadzu spectrophotometer at 323 nm. The drug concentration was determined by comparing the absorbance of the test solution with the standard drug absorbance for Ketorolac Tromethamine, ensuring that the drug content falls within the acceptable limit of 85–115% for content uniformity.
In-vitro Dissolution Test
In-vitro drug diffusion studies were conducted using a 20 mL Franz diffusion cell to evaluate the release of Ketorolac Tromethamine from the transdermal patch. Before mounting, the membrane was stabilized to remove any soluble components. The membrane was then placed between the donor and receptor compartments. The receptor compartment was filled with 20 mL of isotonic phosphate buffer (pH 7.4), and the system was maintained at 37 ± 0.2°C with hydrodynamics ensured by a magnetic stirrer. A 2 cm × 2 cm patch, moistened with a few drops of pH 7.4 phosphate buffer, was placed in the donor compartment. 1 mL samples were withdrawn from the receptor compartment at predetermined time intervals (1, 2, 3, 4, 6, and 8 hours) and replaced with an equal volume of fresh pH 7.4 phosphate buffer. The percentage of drug permeated was calculated by measuring the absorbance of the samples at ? max 323 nm using a UV-Visible spectrophotometer. This study provides insights into the drug release kinetics and permeation profile of the formulation [15-18].
RESULT AND DISCUSSION
Pre-formulation Studies
Solubility Status
The solubility of Ketorolac Tromethamine was tested in various solvents, and the results are as follows: The drug is partially soluble in distilled water, sparingly soluble in acetone, 0.1 N HCl, methyl chloride, and phosphate buffer (pH 6.8). It is completely soluble in methanol, ethanol, DMSO, and chloroform. These findings are essential for selecting the appropriate solvents for formulation and drug delivery system development.
Melting Point
The melting point of Ketorolac Tromethamine was experimentally determined and found to be 206°C. According to the Indian Pharmacopoeia (IP), the standard melting point of Ketorolac ranges between 205–208°C. Therefore, the experimental value aligns with the official standards, confirming the identity and purity of the drug as per the IP specifications.
Ultraviolet Visible (UV-Vis) Spectrophotometry
a) Determination of ?max
Spectrometric scanning and the measurement of Ketorolac Tromethamine ? max in phosphate buffer pH 6.8 revealed the greatest peak at 323 nm, which is regarded as the Ketorolac Tromethamine maximum absorbance (?-max).

Figure 2: ? max of Ketorolac Tromethamine
b) Preparation of Calibration Curve
Ketorolac Tromethamine concentrations ranging from 2 ppm to 15 ppm in phosphate buffer pH 6.8 were chosen for the calibration curve. R2 was found to be 0.9941, suggesting that, within the chosen range, the relationship between drug concentration and absorbance was linear. Figure 3 shows the standard calibration curve, while the table 2 shows the absorbance of various drug doses in phosphate buffer pH 6.8. In the formula y = 0.0576x, x stands for concentration and y for absorbance.

Figure 3: Calibration Curve of Ketorolac Tromethamine
Table 2: Calibration Curve of Ketorolac Tromethamine
|
Concentration (?g/ml) |
Absorbance (nm) |
|
0 |
0 |
|
2 |
0.154 |
|
4 |
0.233 |
|
6 |
0.380 |
|
8 |
0.461 |
|
10 |
0.552 |
|
12 |
0.694 |
|
15 |
0.857 |
Drug– Excipient Compatibility Study by FTIR Spectroscopy
FTIR was used to record the infrared spectra of both pure drug and excipients as well as the mixture of drug and excipients. The spectra were then compared to determine whether the drug and excipients were compatible. The sample included all of the distinctive peaks. Ketorolac Tromethamine did not interact with any of the excipients, according to the results of the FTIR analysis. The characteristic bands of drug are reported in the following table 3.

Figure 4: FTIR of Ketorolac Tromethamine

Figure 5: FTIR of Optimized Batch
Table 3: FTIR Spectrum Peaks of Ketorolac Tromethamine
|
Wavelength (cm??1;) |
Functional Group |
Vibration Mode |
|
3411 |
N-H (amine group) |
Stretching |
|
2950 |
C-H (alkyl) |
Stretching |
|
1745 |
C=O (carbonyl group) |
Stretching |
|
1635 |
C=C (aromatic ring) |
Stretching |
|
1275 |
C-N (amine group) |
Stretching |
|
1220 |
C-O (ether) |
Stretching |
|
1150 |
C-H (alkyl) |
Bending |
|
850 |
C-H (out-of-plane bending) |
Aromatic ring bending |
Differential Scanning Calorimetry (DSC) Study
The DSC thermogram revealed several thermal events, starting with an initial water loss between 50–70°C, indicating the evaporation of moisture. A prominent endothermic peak observed between 110–120°C was associated with the melting of the drug. Another endothermic peak was detected at 170–180°C, which could correspond to the decomposition or degradation of the compound. The sharp endothermic peak observed at 200–210°C corresponds to the melting point of Ketorolac Tromethamine, which is in agreement with the reported melting point range of 205–208°C. Additionally, an exothermic peak between 230–240°C was noted, suggesting further degradation. These results confirm the thermal stability and purity of Ketorolac Tromethamine, indicating no significant interactions with the excipients used in the formulation.
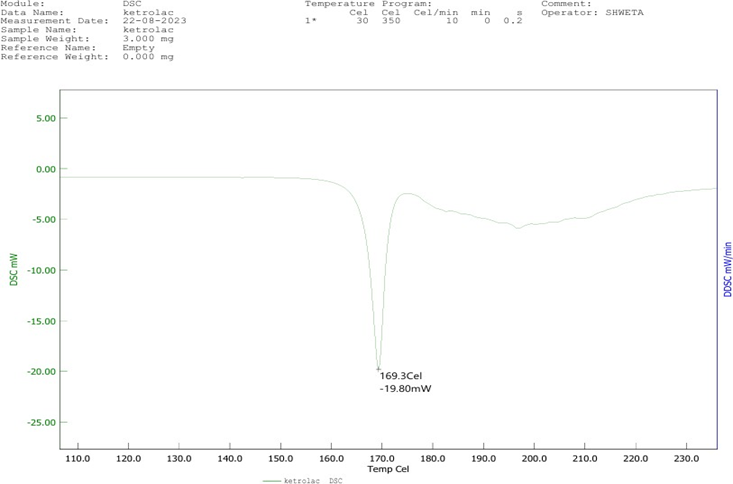
Figure 6: DSC of Ketorolac Tromethamine
Evaluation of Transdermal Patches
Organoleptic Test
The formulated patches were observed as white, amorphous films with a smooth surface, confirming uniform polymer distribution. The patches exhibited transparency, indicating proper formulation without air entrapment or crystallization. Additionally, the patches were non-sticky, ensuring ease of application and removal. These characteristics confirm that the prepared transdermal patches possess the necessary aesthetic and handling properties, making them suitable for transdermal drug delivery.
Weight Uniformity
The weight uniformity of transdermal patches was evaluated to ensure consistent formulation and drug distribution across different batches. The recorded weights for batches F1 to F6 ranged from 84 ± 2.36 mg to 98 ± 4.00 mg, with minimal deviations. The results indicate that all batches maintained uniform weight within an acceptable range, suggesting reproducibility in the solvent casting method. Slight variations in weight could be attributed to differences in polymer composition, solvent evaporation, or film thickness. However, the low standard deviation values confirm that the patches were prepared with high precision, ensuring batch-to-batch consistency. These findings are essential for maintaining formulation uniformity, which directly impacts drug release and therapeutic efficacy.
Thickness of the Films
The thickness values ranged from 0.20 ± 0.003 mm to 0.23 ± 0.004 mm, with minimal standard deviation, indicating precise formulation. The slight variations observed may be due to differences in polymer concentration, solvent evaporation rate, or casting technique. However, the low standard deviation values confirm that the patches exhibited uniform thickness across different formulations, ensuring reproducibility and consistent drug diffusion. Maintaining a uniform thickness is essential for achieving controlled drug release and optimal therapeutic efficacy.
Folding Endurance
Folding endurance was evaluated to determine the mechanical strength and flexibility of the transdermal patches. The results for different batches are as shown in table 4. The values indicate that all batches exhibited sufficient mechanical resistance, ensuring durability and flexibility. The highest folding endurance was observed in batch F5 (214), suggesting a stronger and more elastic film, likely due to optimized polymer composition and plasticizer content. The lowest value was recorded for batch F4 (179), which, while slightly lower, still meets the required mechanical strength for handling and application. Overall, all batches demonstrated satisfactory mechanical properties, confirming their suitability for transdermal application without the risk of brittleness or breakage during use.
Percentage Moisture Content
The percentage moisture content of the transdermal patches was evaluated to assess their stability and susceptibility to moisture absorption. The results for different batches were as shown in table 4. The moisture content ranged from 2.22 to 3.45%, indicating minimal variation among batches. Batch F4 (3.45%) exhibited the highest moisture content, which may be attributed to differences in polymer composition or environmental factors during formulation. Conversely, batch F6 (2.22%) had the lowest moisture content, suggesting better resistance to moisture absorption. Lower moisture content is desirable as it enhances the stability of the patch and prevents microbial contamination. The overall results confirm that the formulated patches maintain an acceptable moisture content, ensuring product stability and integrity.
Drug Content Uniformity
The drug content uniformity of the transdermal patches was evaluated to ensure consistent distribution of Ketorolac Tromethamine across different batches. The results obtained were shown in table 4. The drug content ranged from 95 to 98%, indicating minimal variation and confirming uniform drug distribution within the patches. Batch F5 (98%) exhibited the highest drug content, while batches F1, F2 and F3 (95%) had slightly lower but acceptable values. The uniformity in drug content across all batches ensures reproducibility in formulation and reliable drug delivery. These results confirm that the solvent casting method effectively incorporated Ketorolac Tromethamine into the polymeric matrix, meeting the standard requirements for content uniformity in transdermal drug delivery systems.
Table 4: Evaluations of Transdermal Patches
|
Batch |
Weight (mg) |
Folding Endurance |
Thickness (mm) |
% Moisture content |
% Drug Content |
|
F1 |
84 ± 2.36 |
188 |
0.23 ± 0.004 |
3.16 |
95 |
|
F2 |
90 ± 3.41 |
196 |
0.20 ± 0.003 |
3.40 |
95 |
|
F3 |
87 ± 3.1 |
202 |
0.22 ± 0.004 |
2.34 |
95 |
|
F4 |
92 ±3.49 |
179 |
0.21 ± 0.002 |
3.45 |
96 |
|
F5 |
97 ±3.78 |
214 |
0.21 ± 0.002 |
2.33 |
98 |
|
F6 |
98 ±4.00 |
186 |
0.21 ± 0.003 |
2.22 |
96 |
In-vitro Dissolution Test
The in-vitro drug release study was conducted to evaluate the release profile of Ketorolac Tromethamine from the formulated transdermal patches over 10 hours. The percentage cumulative drug release (?R) for different formulations (F1 to F6) was recorded at specific time intervals, and the results demonstrated distinct release patterns among the batches. Among all formulations, F6 exhibited the highest drug release, achieving 100.02% release at the 10-hour mark, indicating a rapid and sustained drug release profile. In contrast, F1 and F3 reached 98.6% and 93.01% drug release at 9 hours, respectively, demonstrating an extended-release pattern. F2, F4, and F5 showed relatively moderate release rates, with final cumulative drug release values of 95.74%, 92.36%, and 93.75%, respectively, at 10 hours.
During the initial 1–3 hours, drug release was relatively slow, with F6 showing the highest release (25.76%) at 1 hour, while F3 had the lowest (11.2%). By 5 hours, F3 exhibited the highest release (50%), followed by F1 (45.91%), indicating faster diffusion in these formulations. At 6 hours, the release rate increased significantly for all formulations, with F1 (60.31%) and F3 (60.34%) showing the highest release, confirming a steady drug diffusion process. F6, which demonstrated the highest cumulative release, likely benefited from an optimized polymeric ratio and permeation enhancers, facilitating enhanced drug diffusion. F3 and F1 also exhibited effective drug release, suggesting an appropriate balance between polymer concentration and drug diffusion rate (Figure 7). Overall, the results confirm that the formulated transdermal patches successfully provided sustained drug release, making them suitable for prolonged therapeutic efficacy.
Table 5: % Cumulative Drug Release of Transdermal Patches of All Batches
|
Time (hr) |
% Cumulative Drug Release |
|||||
|
F1 |
F2 |
F3 |
F4 |
F5 |
F6 |
|
|
1 |
16.3 |
13.1 |
11.2 |
14.1 |
17.46 |
25.76 |
|
2 |
19.3 |
17.6 |
15 |
16.3 |
19.30 |
28.12 |
|
3 |
25.80 |
25.12 |
18.32 |
26.64 |
27.87 |
37.50 |
|
4 |
28.1 |
33.30 |
32.0 |
27.46 |
39.60 |
39.32 |
|
5 |
45.91 |
39.1 |
50 |
43.7 |
43.90 |
42.09 |
|
6 |
60.31 |
53.41 |
60.34 |
49.2 |
49.91 |
49.78 |
|
7 |
88.2 |
68.7 |
74.02 |
68.02 |
57.45 |
58.03 |
|
8 |
90.36 |
75.02 |
88.43 |
78.43 |
78.39 |
79.45 |
|
9 |
98.6 |
89.76 |
93.01 |
90.05 |
89.76 |
93.75 |
|
10 |
- |
95.74 |
- |
92.36 |
93.75 |
100.02 |

Figure 7: % Cumulative Drug Release of Transdermal Patches of All Batches
CONCLUSION
The present study successfully formulated and evaluated transdermal patches of Ketorolac Tromethamine using the solvent casting method. The prepared patches were subjected to various physicochemical evaluations, including weight uniformity, thickness, folding endurance, moisture content, drug content uniformity, and in-vitro drug release studies to ensure formulation stability and effectiveness. The weight uniformity of all batches was within an acceptable range, confirming consistent drug distribution. The thickness of the films showed minimal variation, ensuring uniform drug release. Folding endurance studies indicated good mechanical strength, confirming the patches' flexibility and durability. The moisture content of the formulations remained low, which is essential for maintaining patch stability and preventing microbial growth. Drug content uniformity analysis revealed that all formulations complied with the pharmacopeial standards, ensuring accurate and reproducible dosing. The in-vitro drug release study demonstrated sustained drug release over 10 hours, with variations among different formulations based on polymer composition and permeation enhancers. F6 exhibited the highest cumulative drug release (100.02%) at 10 hours, indicating its potential as an optimized formulation for prolonged therapeutic action. Other formulations also showed effective drug release patterns, confirming the feasibility of transdermal administration for Ketorolac Tromethamine. The results of FTIR and DSC studies confirmed the compatibility of Ketorolac Tromethamine with excipients, with no significant chemical interactions observed. The DSC thermogram confirmed the drug’s melting point, ensuring its purity and stability. Overall, the study highlights the potential of transdermal patches as an alternative drug delivery system for Ketorolac Tromethamine, offering sustained drug release, improved patient compliance, and reduced systemic side effects compared to conventional oral and injectable routes. Further in-vivo studies and clinical evaluations are recommended to establish the therapeutic efficacy and pharmacokinetic profile of the developed patches.
REFERENCE

Ashwini Karnakoti*, Dr. Amol Borade, Prajwal Birajdar, Vishal Bodke, Mangesh Dagale, Ruchita Badekar, Formulation and Evaluation of Transdermal Patch, Int. J. Sci. R. Tech., 2025, 2 (2), 77-86. https://doi.org/10.5281/zenodo.14837862
 10.5281/zenodo.14837862
